
After maintaining a steady rhythm of four draws in February and March, Express Entry activity slowed noticeably in April, with fewer invitations issued across fewer rounds.
April saw the issuance of 1,246 Invitations to Apply (ITAs) across a total of two draws, with Immigration, Refugees and Citizenship Canada (IRCC) targeting Provincial Nominee Program (PNP) candidates for both.
See your eligibility for all Express Entry streams
While the immigration department continues to prioritize PNP draws—consistent with recent trends—the absence of French-language proficiency and Canadian Experience Class (CEC) draws marks a clear departure from the department’s established patterns earlier in 2025.
Thus far in 2025, IRCC has issued 4,079 ITAs to PNP candidates through Express Entry draws.
IRCC has already held the first draw of May, inviting educational professionals through the Express Entry system for the first time.
This article will cover
- The draws that took place in April;
- The current distribution of scores within the Express Entry candidate pool; and
- How your Comprehensive Ranking System (CRS) score ranks against other candidates in the pool.
What draws took place in April?
April was limited to two PNP-specific draws, resulting in a combined 1,246 ITAs issued by the immigration department.
Cut-off scores for each of the two draws were in the 700s.
| Draw number | Date of draw | Draw type | ITAs issued | CRS cut-off score |
|---|---|---|---|---|
| 342 | April 14, 2025 | Provincial Nominee Program | 825 | 764 |
| 343 | April 28, 2025 | Provincial Nominee Program | 421 | 727 |
Overall, the number of ITAs issued in April was significantly lower than in any of the previous three months:
In fact, April saw fewer than one-tenth the number of ITAs that were issued just a month prior.
The quantity of draws and number of issuances in April most closely resemble figures from draws that occurred as far back as May 2022, which also only saw two PNP draws and had a similar combined total of 1,135 ITAs issued.
Despite IRCC’s February 27 announcement that CEC candidates would be prioritized for Express Entry ITAs throughout 2025, no CEC-specific draws have taken place since February 5.
What is the current distribution of scores in the Express Entry pool?
The table below breaks down the number of candidates within each score range as of April 27, 2025.
Overall, there are 2,391 more candidate profiles in the pool at the start of May, as compared to April 14—the closest draw date to the start of April.
| CRS score range | Number of candidates |
|---|---|
| 0-300 | 8,566 |
| 301-350 | 22,553 |
| 351-400 | 53,640 |
| 401-410 | 12,469 |
| 411-420 | 13,274 |
| 421-430 | 13,385 |
| 431-440 | 14,909 |
| 441-450 | 14,230 |
| 451-460 | 14,964 |
| 461-470 | 16,313 |
| 471-480 | 16,411 |
| 481-490 | 12,544 |
| 491-500 | 12,291 |
| 501-600 | 20,708 |
| 601-1200 | 416 |
| Total | 246,673 |
For enhanced clarity and easier comparison, this data is also presented below as a bar graph.
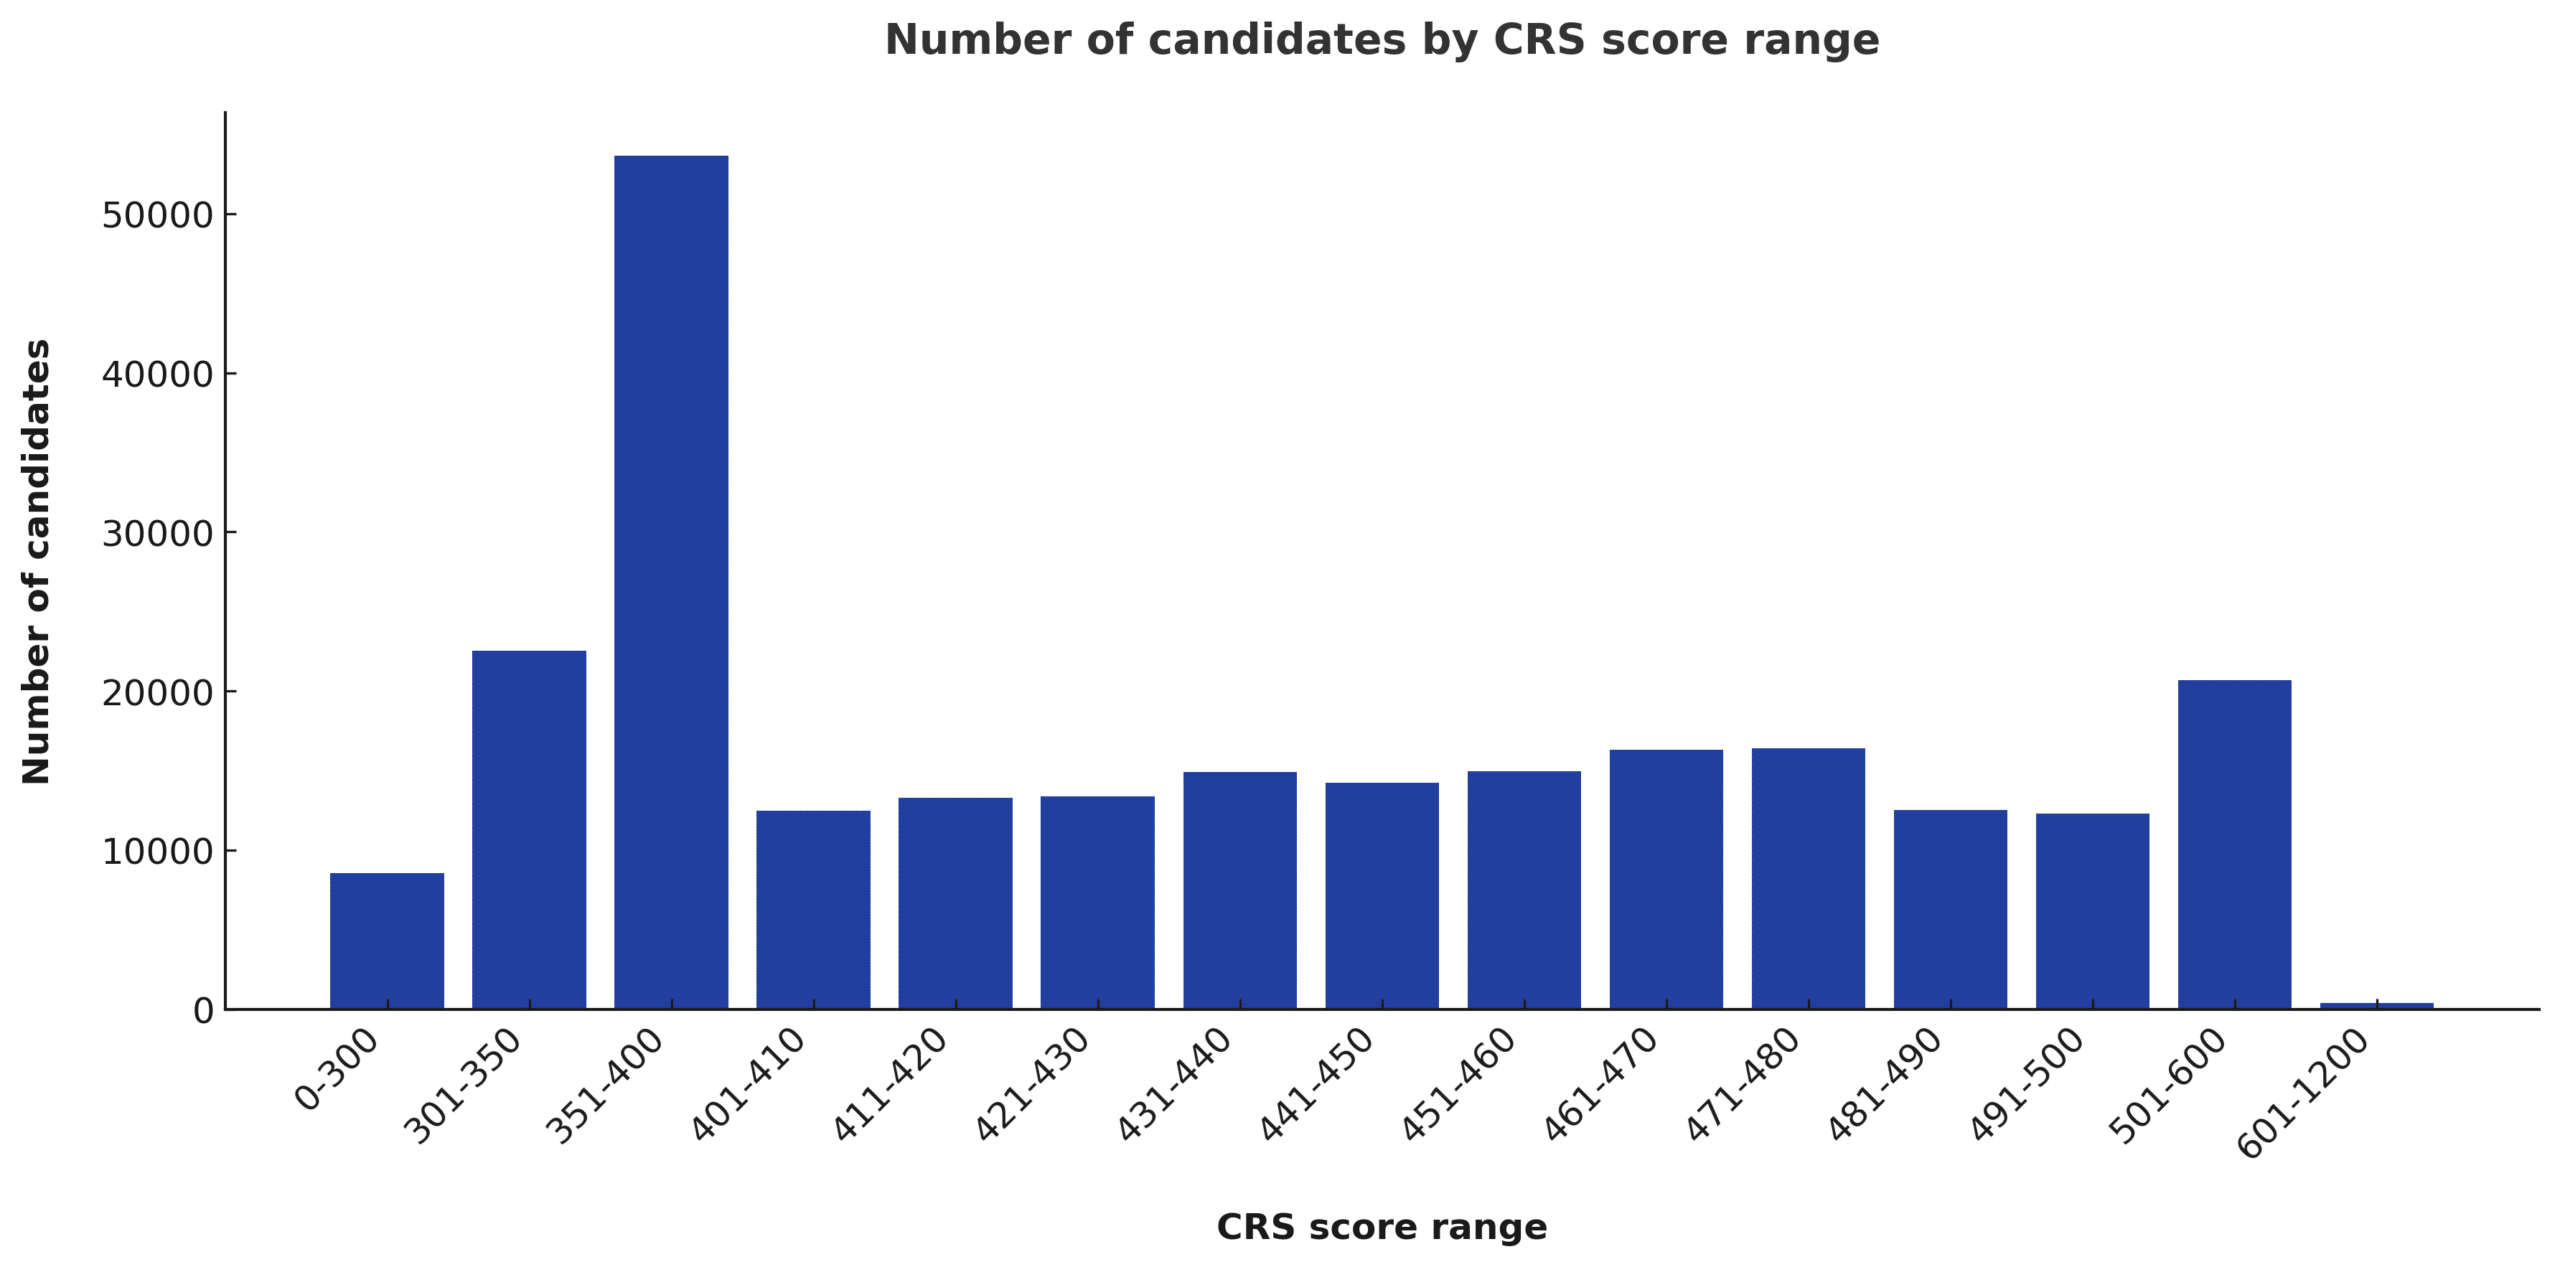
Of note is that the number of candidates in all CRS score ranges up to 471-480 increased since the beginning of March, while the number of candidates in each subsequent score range decreased.
This decrease may be attributed to IRCC’s recent decision to remove CRS points for arranged employment as of March 25, 2025. With candidates no longer receiving 50 or 200 points for arranged employment, there is a lower number of candidates with scores of 481 or higher.
How do scores in the Express Entry pool rank against each other?
The table below provides the current distribution of CRS scores within the Express Entry pool as of April 27, 2025. It includes the percentile ranges for each score boundary, as well as the proportion of candidates in each score range relative to the total pool.
Candidates in the Express Entry pool can use this table to see where their CRS score stands relative to other candidates currently in the pool.
Methodology: The percentile scores in the table below were calculated for the upper boundaries of each CRS score range, indicating the share of candidates at or below that score. Percentiles are shown as ranges to improve comprehension, indicating that candidates within each CRS score band fall somewhere between the corresponding percentile values.
| CRS score range | Number of candidates | Percentile range | Percentage |
|---|---|---|---|
| 0-300 | 8,566 | 0 – 3.47% | 3.47% |
| 301-350 | 22,553 | 3.47% – 12.62% | 9.14% |
| 351-400 | 53,640 | 12.62% – 34.36% | 21.75% |
| 401-410 | 12,469 | 34.36% – 39.42% | 5.05% |
| 411-420 | 13,274 | 39.42% – 44.80% | 5.38% |
| 421-430 | 13,385 | 44.80% – 50.22% | 5.43% |
| 431-440 | 14,909 | 50.22% – 56.27% | 6.04% |
| 441-450 | 14,230 | 56.27% – 62.04% | 5.77% |
| 451-460 | 14,964 | 62.04% – 68.10% | 6.07% |
| 461-470 | 16,313 | 68.10% – 74.72% | 6.61% |
| 471-480 | 16,411 | 74.72% – 81.37% | 6.65% |
| 481-490 | 12,544 | 81.37% – 86.45% | 5.09% |
| 491-500 | 12,291 | 86.45% – 91.44% | 4.98% |
| 501-600 | 20,708 | 91.44% – 99.83% | 8.39% |
| 601-1200 | 416 | 99.83% – 100.00% | 0.17% |
| Total | 246,673 | ||
See your eligibility for all Express Entry streams